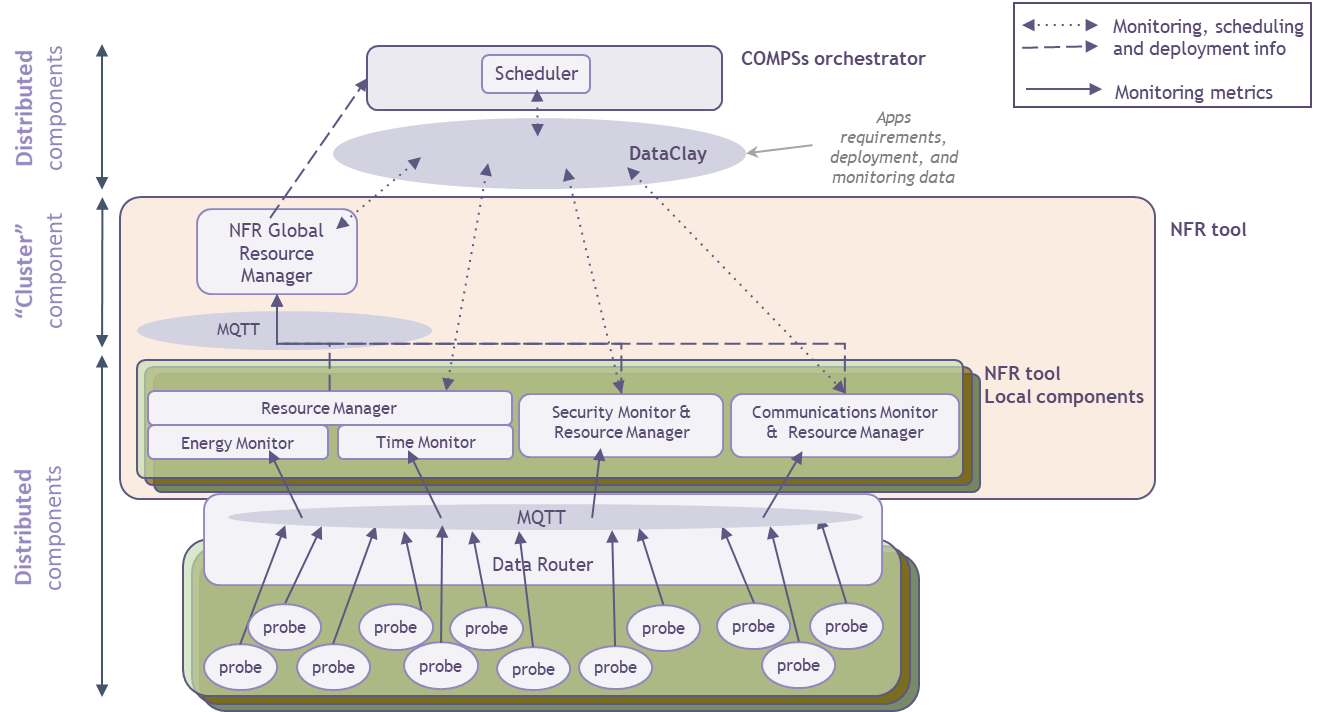
This layer implements the set of tools and components to continuously monitor the behaviour of the ELASTIC system regarding the fulfilment of non-functional requirements (time, energy, communication quality and security). The NFR tool architecture is shown in the figure below, consisting of the following key components:
- At the lowest layer, a probing mechanism has been implemented, consisting of several application or system tools that extract relevant metrics from the underlying hybrid fog computing platform, published by a Data Router.
- Three distributed NFR tool components (NFR monitors) for time and energy, communication quality and security, which monitor the corresponding properties and detect violations concerning a predefined set of thresholds based on the application and system requirements. The NFR components are deployed in each available edge node where the analytics workflows are executed.
A Global Resource Manager (GRM) entity that has a holistic view of the ELASTIC system over a cluster of edge nodes monitored by the distributed NFR tools, where multiple analytics applications may be executed. The GRM receives the metrics and violations reported by the NFR monitors and elaborates a list of available resources (i.e., computing nodes and a number of available CPUs) recommended per application (also considering each application’s requirements and priority level). These recommendations are passed as an input to the orchestrator layer, which is then responsible for enforcing the allocation of computational tasks on the available resources based on the implemented scheduling policies.
Check all the details in the ELASTIC GitLab sub-group repository: https://gitlab.bsc.es/elastic-h2020/elastic-sa/nfr-tool