Written by Cesar Marin, Information Catalyst
Big data is a topic widely regarded as important because of the common problems faced by organisations that see their data increase over time. However, just “applying big data analytics” out of the box is not so simple to implement even with existing tools available these days. Common tool providers assume data owners want to apply traditional data analytics such as adjusting predefined models seen in other cases but applied to new ones. However, this is not always the case.
Each application is unique and predefined models not always apply to all cases. It is becoming more common to find data owner that realise their case does not fit the traditional case and end up telling to themselves “I have the data but I don’t know what it means. Can data analytics be of any help?” This situation requires some thinking: how can we help data owners discover data patterns without using predefined data models?
The ELASTIC project recently faced this situation. Having created predefined data models for the transport domain would have provided a too accurate but rigid model, which could have been sufficient in a world where nothing changes. However, things changed drastically at the beginning of 2020 with the Covid-19 pandemic: transport patterns changed overnight in such a way that nobody could have predicted; suddenly people hugely reduced transport usage; public transport service was reduced to a minimum; and there was no way to tell when or if it would be back to “normal”. How is ELASTIC dealing with this situation?
The ELASTIC project has three ways of supporting a transport infrastructure that has been hardly hit by Covid-19:
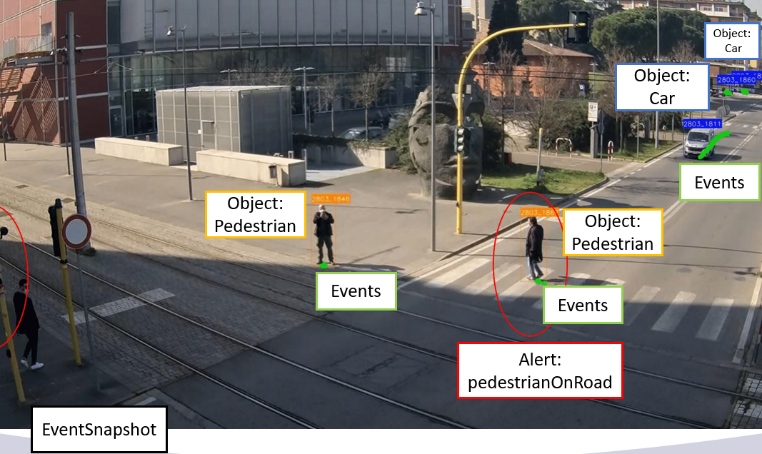
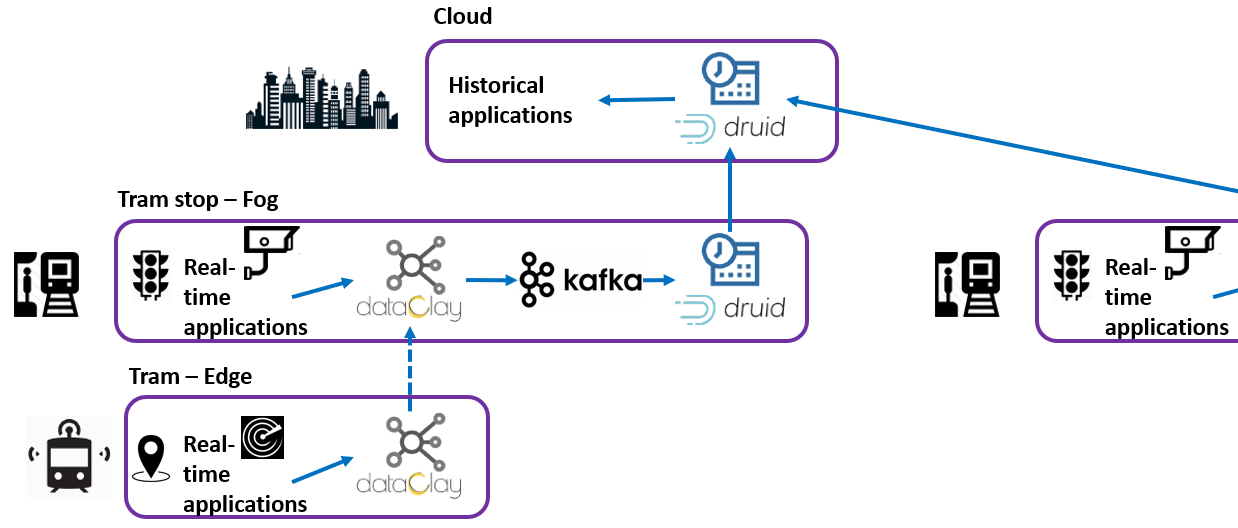
1. Data is generated by a number of real-time analytics distributed across the transport network. This data represents entities such as cars, people, trams, etc. moving in the city. This data is then collected via a distributed data analytics platform (DDAP) that functions as a Content Delivery Network, collecting data from edge devices in trams, passing it through fog computing cabinets at each tram stop, and propagating the data up to the data centre at the tram depot. Data is available for processing both for real-time and historical purposes and completely independent of any transport situation.
2. At the data centre in the tram depot, data is passed through a series of micro filters and micro aggregators that separate data into smaller units with their timestamp and combine them in meaningful ways, respectively. Once this is done, pattern finding algorithms are applied to the resulting data. These algorithms do not apply any predefined model nor expect any “known pattern” to be found. They discover patterns hidden in the data. If data changes over time, say because of new transport patterns triggered by new Covid-19 responses, these are also discovered as more data accumulates. This increases the reliability of the ELASTIC architecture to support changing transport conditions due to the current pandemic.
3. Nevertheless, pattern prediction is also present in ELASTIC architecture for detecting and predicting track wear, although not done in a traditional way. Track profiles are obtained via a specialised laser measurement unit under a maintenance vehicle. Then another algorithm processes that data for finding hidden patterns, but rather than fitting data to predefined models, it creates and maintains different data models in parallel. Over time these models learn more, get merged with similar ones, or simply disappear if no longer relevant. This model management mechanism allows the pattern prediction tool to adapt to changes happening in the tram network that are reflected in the track wear data. Therefore, it makes ELASTIC a robust architecture that can stomach unexpected changing data patterns without prior knowledge.
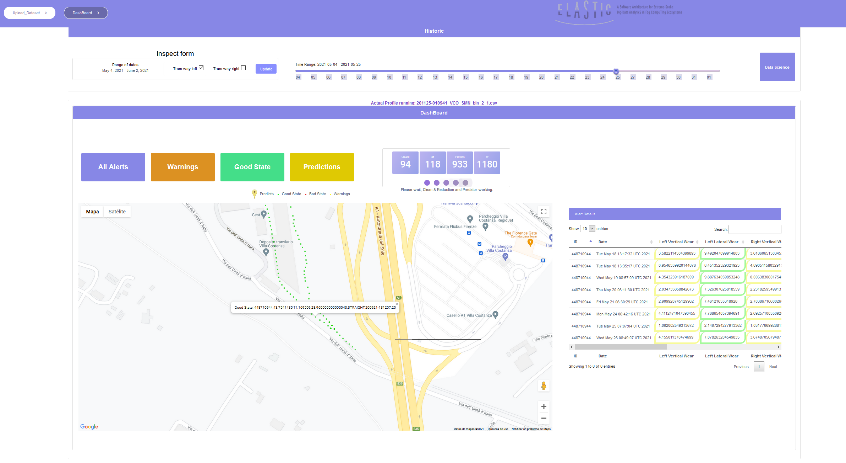
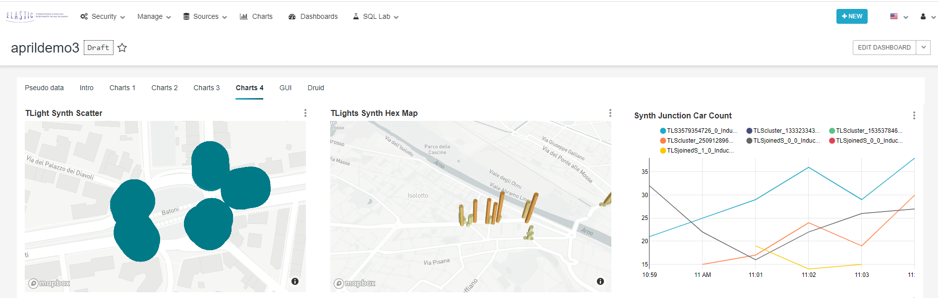
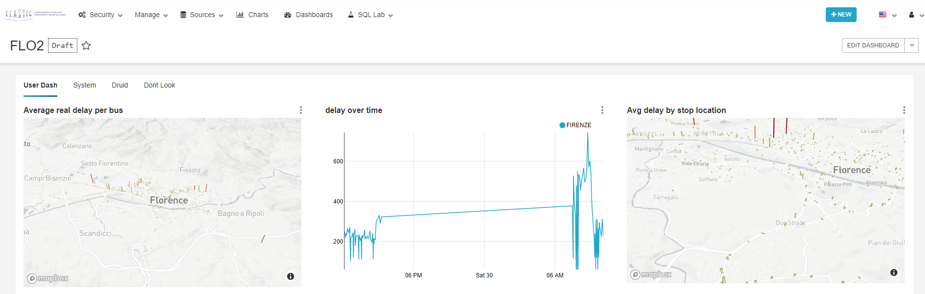
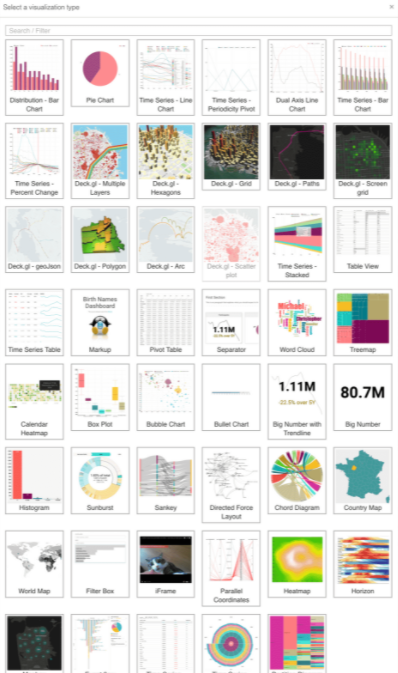
Furthermore, pattern finding algorithms are not sufficient without a variety of visualisation techniques to interpret data. One of the tools provided by ELASTIC, based on Superset, consists of an analytics dashboard. This tool allows the user to choose the data they want to explore and how they want to see it. Users have a variety of nearly 50 different graphs to choose from and create different dashboards according to their needs.
ELASTIC is still an ongoing project and it is currently being applied in the transport infrastructure of the Metropolitan City of Florence in Italy. Florence was one of the first locations hit hard by Covid-19 in Europe. The transport network and all its suppliers, just like many similar networks across Europe, have suffered the effects of partial or total transport shutdown because of the pandemic. But the city has shown its resilience and has been adjusting to many “new normal” situations. It just makes perfect fit to equip the city with a software architecture as resilient and robust as its transport infrastructure.