Written by Cesar Marin (Information Catalyst). Contribution: Anna Queralt (BSC)
It is not new that cities could have an improvement in their transport system by using big data analytics. Some examples include Dublin, Singapore, and Modena. Yet they are not unique. There are more examples all over the world and each with its own specific features, modes of transport, and mobility problems to solve.
ELASTIC project, via its practical use case in the city of Florence, is looking at solving the following problems:
• Predict obstacles in front of trams in order to minimise collisions
• Improve overall traffic by making public/private transport interactions more efficient
• Predict maintenance needs of public transportation to minimise operational costs and increase the reliability of the service
Moreover, the city of Florence offers the following data from its infrastructure:
• Data is generated at each tram from a number of sensors and cameras. So, this data represents the “experience” of each single tram regarding obstacles in front of the tram, travel speed, energy consumed (as a function of how number of people on board), acceleration and breaking.
• Data is also generated at each tram station. Likewise, this data represents the “experience” of that station in terms of crowd levels, tram arrival and departure times.
• At certain times, a dedicated tram runs along the network measuring track wear and possible broken tracks.
• Bus stops also provide data related to bus timetables and whether a bus is at the station or not.
All the above indicates a clear application of big data analytics. Nowadays, in parallel to the different mobility problems in cities, there is a myriad of software architectures for big data analytics. From open source to vendor solutions, including combinations of them. Regardless of the availability of architectures, there is still a big question to answer when aiming at providing big data analytics to a new, city-wide, use case: Including vendor solutions. How do we do it? The answer is never straightforward. There are many elements to consider: from data availability from transport infrastructure to high level mobility problems citizens face day-to-day.
In order to achieve it, it is necessary to set up an underlying platform that guarantees data availability at the point of request. It also has to allow the possibility of adding aggregation tasks on the fly as close as possible to the point where data is being generated. We call this underlying platform Distributed Data Analytics Platform or simply DDAP. DDAP is still considered work in progress. Nevertheless, the motivation is high and the vision is to see the city of Florence with a state-of-the-art architecture for big data analytics.
ELASTIC is investigating two DDAP solutions for addressing data ingestion and storage.
The first solution explored by the ELASTIC project is based on dataClay1, a distributed data storage system developed by BSC and presented in the image below:
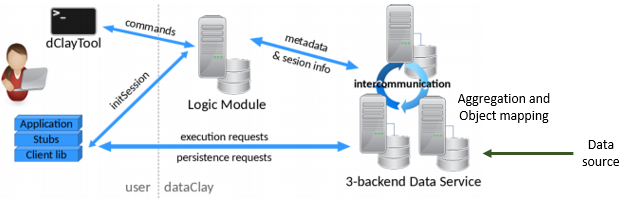
In the figure, data source enters the dataClay directly at the backend data service where it is indexed, aggregated and organised into a predefined data model. This results in data being treated as objects by the application, i.e. as a user there is no longer a need to specify a connection to any database (which still happens in the background). Moreover, each data service could potentially be federated and distributed along the transport infrastructure. Thus, any call to an object’s method will return the most recent value, belonging to that object, stored in one of the backend data services. This provides versatility to the user programming applications based on dataClay.
The second solution explored by ELASTIC is based on Druid and it is depicted as follows2:
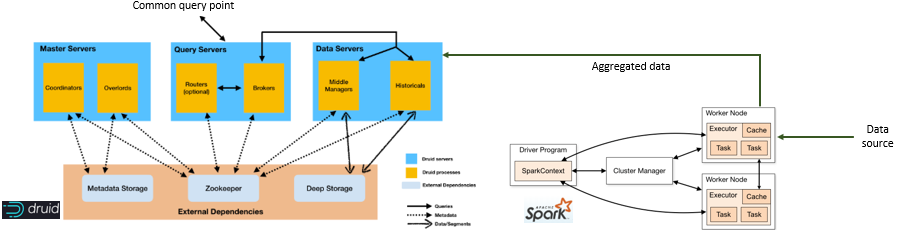
In the figure, data is ingested by aggregation and processing Tasks (right side of the figure), which generate meaningful, additional information to the original data. These Tasks can identify, generate, and correlate events in the transport infrastructure. Notice that Tasks run close to the data source, thus that data is relevant to that, e.g. tram station, source only. In the figure this is realised by Spark.
Aggregated data then flows to Data Servers where it is stored and indexed as columns. This facilitates slicing data by physical entities. Part of the indexing consists of making metadata available to Query Servers, which are a common query point for big data analytics tools. Consequently, a data analytics tool would query the Query Servers who then contact the relevant Data Server for accessing the requested data. In the figure this is realised by Druid.
Druid and dataClay are complementary solutions that can be combined in a software stack to provide the data analytics functionalities required by ELASTIC. On the one hand, Druid is designed to provide a central access point for efficient time-based queries and workloads based on event-driven data, and can offer a global view of the events related to the different tram stations. On the other hand, dataClay is focused on optimizing the processing of data near the source, and allows to manipulate and share portions of the data between the different parts of the infrastructure. Thus, in the approach being investigated, dataClay ingests raw data from the sources and pre-processes it in-situ (in trams and tram stations), and then handles the relevant events to Druid, which is used to support global time-based analytics workloads. Outputs of the analytics can then be used to take global decisions, or incorporated back to the different parts of the infrastructure to enrich their partial knowledge.
Overall, ELASTIC is aiming at delivering tangible mobility results for the benefit of citizens in Florence, which has a clear impact to other cities in Europe.